Monday, May 12, 2014

Final Project: Final Blog Post

The main goal of our project was to educate people about the Mars Rover Missions and demonstrate the very basic tasks that the Rover can perform on Mars.

In order to engage the audience, we decided to give them the task of programming the Rover using PicoBlocks, and have the Rover run through the martian terrain, past the hill, picking up rock samples along the way.

When we first started brainstorming for the project, we researched some background information about Mars and the Rover. According to the information that several generations of Rovers have obtained, Mars has a rough terrain, with a lot of rocks and hills. In addition, the Rovers have a camera (or multiple cameras) and a robotic arm that collects samples and breaks rocks. In order to incorporate these things into our Rover, we wanted to make a cell-phone stand on the Rover to take pictures and stream videos. For the robotic arm, we wanted to make a claw that would pick up the object upon sensing it through the light sensor. 

We decided to make the Mars terrain out of Styrofoam and glue on Styrofoam rocks to mimic the actual Martian terrain. We also made a hill, but we needed to adjust the height of the hill several times until we found the height that the Rover can actually drive over.
  
One of the first challenges that we faced was making the flexible front wheels. Since the Rover needed to climb up and down the hill, it was important that the front wheels could move up and down according to the angle of the terrain. Our original plan was to make 6 wheels, with 2 flexible front wheels, and 2 middle wheels that are powered by two motors.  
 Later on, when we added the claw, it was very difficult to find a way to keep all 6 wheels and the claw at the same time. So we decided to get rid of the flexible wheels and make the Rover as compact as possible. We also decided to use bigger wheels for greater torque.
 
The claw gave us the most trouble, because we experienced difficulty trying to have it grab the object without getting caught on the hill. 

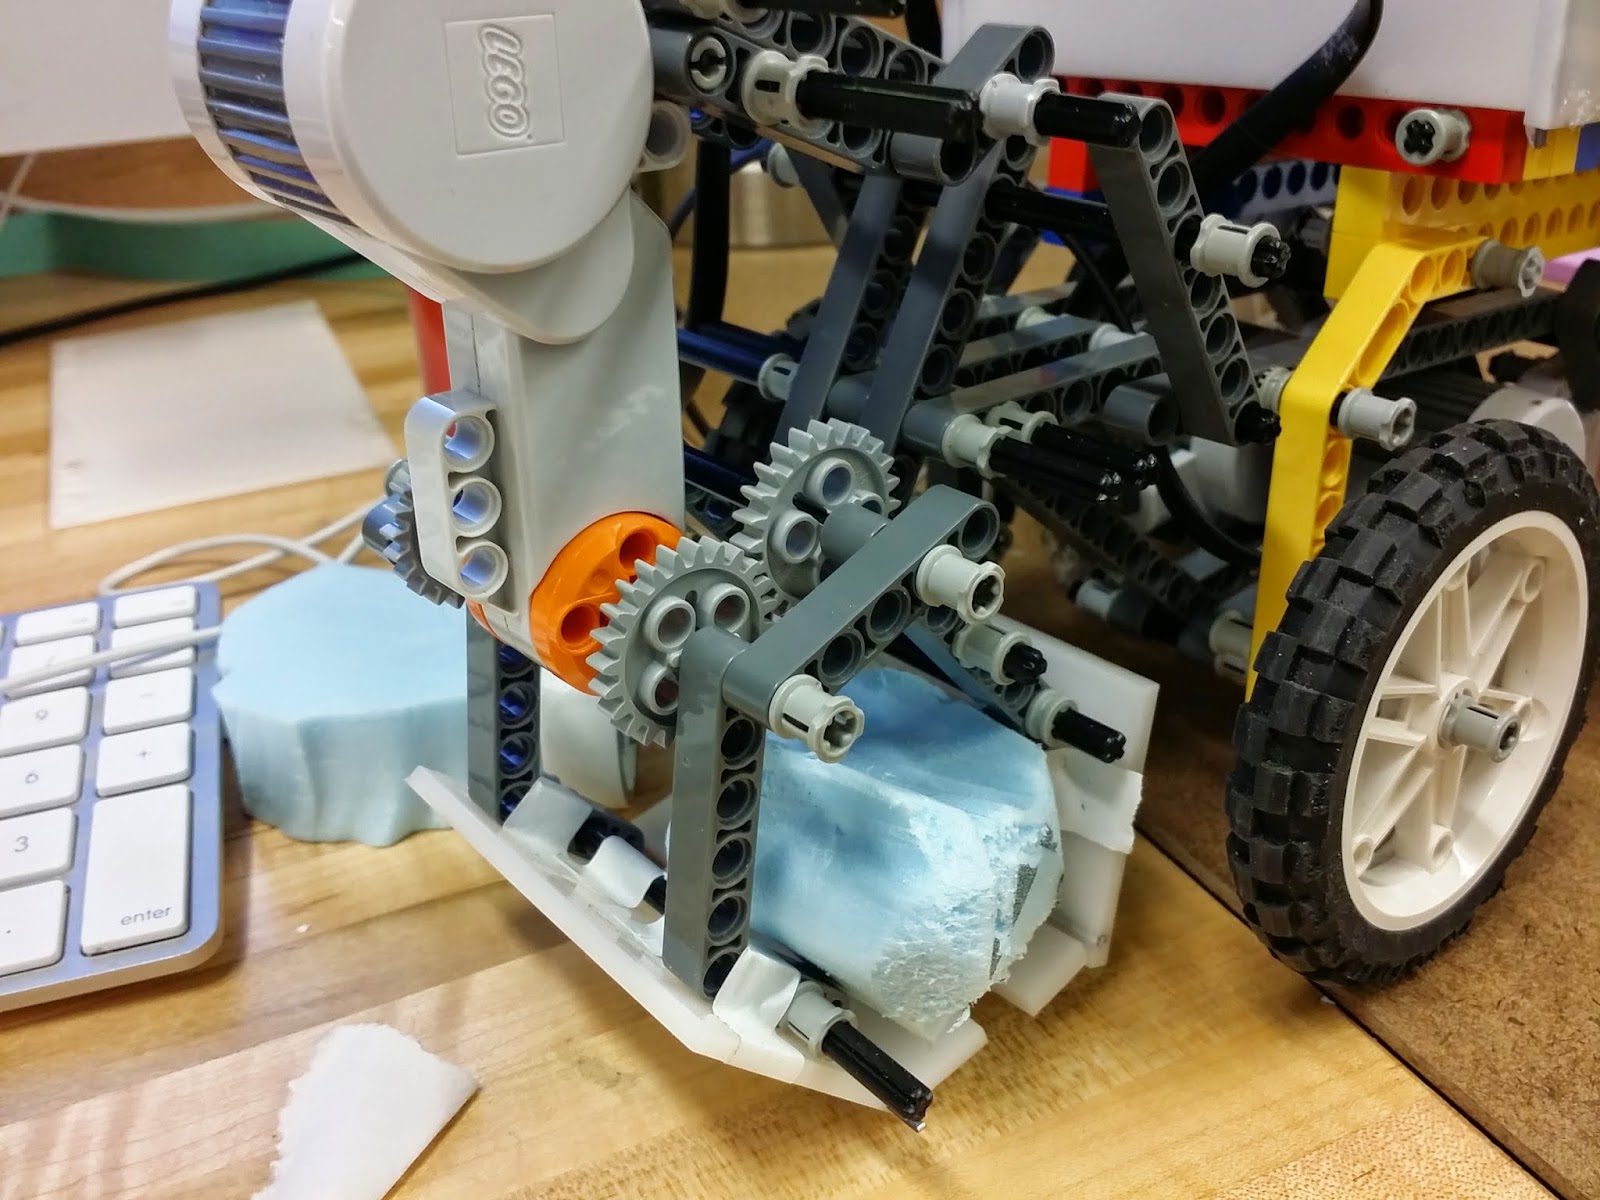
We went through many iterations, and changed the claw so frequently that it was hard to document all the iterations. At first, we only had the upper part of the claw connected to the motor. We soon realized that it might be better to have both sides of the claw moving, so we used gears to move both sides of the claw.


We experienced a lot of problems having the claw so close to the ground because it could get caught when the Rover was going over the hill. We changed the positioning of the claw so it is closer to the center of the Rover, and we also tried to put magnets on the claw and put a paper clip on the object. 


After many many trials, we found that the only way to get the claw to work was to change the claw so that only the top part moves. Also, instead of making the claw out of delrin, we used foam core so it could be more flexible. Also, instead of using Styrofoam as the object, we covered plastic balls with paper.


Our original plan was to mount a phone on the Rover and use Google hangout to stream video to a laptop, but we found out that the Rover could not support the weight of the phone and the delrin that was used to hold the phone in place. 


We tried making compact versions of the phone stand, but the Rover would not go over the hill. We decided that the only way to have a functioning Rover is to get rid of the phone.


 Before the exhibition, we made custom blocks on PicoBlocks so the users wouldn't be overwhelmed with the amount of programming that they would have to do.


During testing, we found out that the light sensor could not sense the object (martian rocks) fast enough if the Rover is moving too fast. At the same time, the Rover would not be able to go past the hill if we lowered the power altogether. Therefore, we made two types of forward commands, one with power set at 100 and another with power set at 80.


The participants were informed about the project and the NASA Rover, and were asked to program the Rover using PicoBlocks. To get started, the participants tested different command blocks. For example, they tested the FWD (forward) block to determine the approximate distance that the Rover travels. Then, they tested the RdSens (read sensor) block so they could see the different sensor readings for the terrain and the object.

We allowed the participants to program a code that would make the Rover successfully go past the hill and grab the object. 

Here are some examples of the codes that our participants constructed. 
 Initially, about 2-3 FWD(power=100) blocks were used because the Rover needed to go over the hill. Afterwards, the if-then block tells the Rover to stop for 2 seconds and close the claw when the sensor detects an object, and keep going forward slowly (power=80) if it doesn't detect an object. 

We assisted the participants and led them to the right direction when they were having trouble programming. Overall, the participants were very engaged and seemed determined to get the Rover to work. It was very interactive, so we could not accommodate as many participants, but I really enjoyed the experience.


 While doing research for the poster, we found out that the Rover that we modeled after was from the Mars Exploration mission from 2003, and the most recent Curiosity Rover uses very advanced technology. For example, instead of solar power, the Curiosity Rover uses radioisotope thermoelectric generator that generates electricity from radioactive decay. Also, the Curiosity was gently lowered to the ground by a 'sky crane' rather than being inside an airbag as it fell from the sky. 

Video of working claw:
Video of Rover completing its 'mission':

It would have been nice if we could include the camera on the Rover, so I would have liked to spend more time in trying to get it to work. Also, I'd like to perfect the claw so it can grab objects with more ease.  

Tuesday, April 29, 2014

Final Project: Day 5 + Weekend + Monday(4/28) Evening

Michelle and I spent several days (and many sleepless nights) trying to finish up the project. 

During class on Friday (4/25), Michelle worked on perfecting the claw while I worked on making the Rover's parts out of Delrin.

We decided to make our Rover appear similar to the Spirit/Opportunity Rover.

Sprit/Opportunity Rover
After looking at the picture of the Spirit Rover, I made measurements of our Rover to start making the parts. We wanted a box to cover the Pico board and a delrin cutout of the shape of the solar panels. 

Measurements
For the box, I made measurements of the Pico board and the areas that we needed access to (switch, sensor and motor plugs etc) and made a sample out of foam core. For the solar panels, I calculated the different angles for easier drawing in solid works. 

Foam core model of the box
After making the foam core model, we drew the parts on solid works. 
We made a last minute decision to try to piano-wire the box together, so we had to fix the solid works design to include ridges. 

Saturday (4/26)

We finished up making changes to the solid works designs and cut them out using the laser cutter. Afterwards, I spent a great amount of time trying to piano-wire the box together.
Solid Works Drawing of the top of the box

Meanwhile, Michelle perfected the claw so that the motor for the claw is facing perpendicular to the ground. After having worked on it for so long, we had to remove the flexible front wheels to attach the claw more effectively. We decided that it needed a sturdier claw to grab things more easily, so Michelle made a claw out of delrin and also piano-wired the parts together.
Claw
During the process of testing different elements, we decided replace the original wheels with bigger ones because it could run over the rough and rocky terrain better. 

We also tried painting some foam rock pieces with spray paint:


After fixing the claw and attaching the box/solar panels, our Rover looked a lot more like the actual Rover!


Sunday (4/27):

I spent most of the day trying to decorate the Rover with metallic spray paint and building the terrain. We also programmed the Pico blocks and made different command blocks (forward, backward, left, right, open/close claw etc). Michelle tested out the Rover on  the newly built terrain and tweaked the design of the Rover. She also filed a white Styrofoam into a ball for the claw to grab. 

Monday (4/28):  

Michelle and I came into the studio at different times of the day to work on different parts of the project. I worked on the camera/phone stand using Solid works and assembled the pieces using glue. I also tried to connect the camera on the phone to the laptop. 

t
The phone stand fell off multiple times, so we used stronger glue to secure the stand.
 
After yesterday, Michelle realized that the Rover cannot run over our terrain because some of the rocks were too big. So I worked on cutting down the rocks so that the Rover would be able to run through it. Michelle worked on making a hill on the terrain and painting the terrain. The hill was problematic because the Rover could not run over hills that were too steep. Our original goal was to have the Rover go through hills and ditches, but we decided to include a single hill in the terrain. She also made finishing touches on the project while I worked on the poster for the presentation. 

The purpose of the poster was to inform the audience about the Mars Rover and introduce them to our project.

(This is the mess I made in my room trying to make the poster)
  
This is how our Rover looked like:


Final Project: Works-Like & Looks-Like Model

Day 3 (4/15):

Since last class, we have tried to finish making the structure of the Rover using Legos. This was surprisingly a long process because we did a lot of tweaking here and there to minimize the amount of blocks used. After the basic structure was finished, we put the Pico board on top and started to work on the front wheels.

One of the major problems that we faced was making the front wheel 'flexible'. Since we are planning to drive the Rover up and down a hill, it would be best to have wheels that have some flexibility to move up and down. In order to do this, we needed a 'stopper' that would stop the wheel from moving too much, but still allow them to move within the range. 

Michelle and I tried many different methods using the Legos and finally figured out the best way to make the flexible front wheels.

We tested out the wheels by making the rover go up the ramp, and it worked nicely!  

After the wheel was perfected, we decided to work on the claw during the remainder of the class. We spent most of the time trying to figure out the best way to make the claw and testing out different options.


Day 4 (4/18):


Today in class, we decided to continue working on the claw.  Since we only wanted to use one Pico board, we had to make the claw using one motor. This was very problematic because having one moving side of the claw was not sufficient to grab objects.

 
We also decided to place the claw at the back of the Rover, which shifted the center of mass of the Rover and lifted the front wheels. To fix this, we put some weight blocks at the front of the wheel.

After testing different methods, we finally figured out that gears were the key to solving our problem. Using 8 teeth and 24 teeth gears, we made the claw so that both sides of the claw moves, grabbing the object more successfully. We used the 8 teeth gear for the bottom part of the claw, so it could rotate faster and scoop up the object.

We had to spend a lot of time perfecting the claw because the gears would go off track quite frequently. In the end, we decided to use 24 teeth gears for both claws, and we found a way to secure the gears in place so it wouldn't go off track. In addition, the claw worked best when it was attached at the front of the Rover, so we moved the claw to the front, which eliminated the need for weight blocks.

We also made a sample terrain using foam, and glued some foam rocks on it as a part of the looks-like model.


Tuesday, April 15, 2014

Final Project: Testing Critical Elements


Today during class, Michelle and I decided to start making the Rover out of LEGOs. Since part of our project focuses on modeling the Rover, we thought it would be best to make our model appear similar to the actual Rover. In order to do this, we decided to make the model from scratch rather than modifying the SciBorgs. 

One of our critical elements was having 'flexible' front wheels so that the Rover would be able to move up and down a hill and escape from a ditch. 
Through many different trials, we were able to get the basic structure of the Rover powered by two motors on the back wheel, and two flexible front wheels.       

Friday, April 11, 2014

Final Project: Brainstorming, Research, Clear Goal

For the final project, Michelle and I was assigned to the Mars Rover.
Since the purpose of the project is to make an exhibit that is educating, we decided to model the actual Mars Rover used by NASA and demonstrate the tasks it performs on Mars.

Our main goal is to have the Rover navigate around the terrain using bang-bang and proportional control. We would also make our model Rover perform certain tasks that an actual Rover performs on Mars. Some examples are collecting rock samples, taking pictures, breaking rocks. We were also thinking of making a robotic arm that can be used to pick of objects. 

Through the exhibit, the visitors will learn about NASA's Mars Rover mission and learn about the different control mechanisms that is used in making the Rover.

We decided that it would be easiest to make the Rover mostly out of LEGOs and use delrin for bigger structures. To build the Mars terrain, we decided to carve Styrofoam. 
We are using the touch sensor and possibly brightness and ultrasonic sensors.       


What will people learn from this exhibit?
How will they learn this?
What mechanisms will be used?
What sensing, feedback, and control will be used?
What physical aspects of the device will we create from raw materials?

MATLAB Thermal Systems Part 2

Deliverable 1:

x-axis: time(s), y-axis: temperature(K)
Using the above heating curve, we were able to determine the thermal resistance and heat capacity:

(See 'MATLAB Thermal Systems Part 1-Working Backwards' for details on how to calculate Rth and C using the heating curve)


From physics, we know that the definition of a time constant is the value of t that makes e^-(t/RC) equal e^(-1).  
Using the Rth and C values calculated from the graph, the time constant comes out to be 93.84 seconds:
The graph shows that y(300) = 357.05K and y(0) = 304K. Therefore, the time constant is the x value that corresponds to the y value of (357.05-304)*(63.2%)=33.53.
Using the cursor, we determined this value to be 96 seconds, which is close to the time constant deduced from the figure.

In simpler terms, we expect the system to heat up 63.2 percent in 93.84 seconds but the experimental data show that the time is 96 seconds. The percent error is 2.25%, which means the values are pretty close.


Deliverable 2:

In order to simulate the heating curve of the resistor, we used the heatsim.m file from the previous assignment but changed the P, Rth and C values. 


Link to heatsim.m file:
https://drive.google.com/file/d/0Bymp1CBCUUYRbGxYYVFrYUI2ZTA/edit?usp=sharing 


The simulation graph looks almost identical to the experimental heating curve, with the temperature leveling off at about 304 K.


Deliverable 3: Bang-bang controller

 
  For the bang-bang controller, we simply used an if-else statement to set the power to 100% when the temperature is less than the desired temperature and 0% when the temperature is greater than the desired temperature.


Bang-Bang Controller; x-axis: time(s), y-axis: temperature (K)

As the graph shows, the temperature successfully reaches our desired temperature of 340K.

Using the bang-bang control script from the last assignment and plugging in the right variables, we were able to obtain the following graph:
Bang-Bang Simulation
The simulation graph shows more fluctuations but is essentially the same as the experimental graph. 

Link to the Bang-Bang Controller .m file:
https://drive.google.com/file/d/0Bymp1CBCUUYRYXc1SGpqMjhOVkk/edit?usp=sharing 

Link to the Bang-Bang Simulation .m file:
https://drive.google.com/a/wellesley.edu/file/d/0Bymp1CBCUUYRRkNHMkdiQXVmWDg/edit?usp=sharing 


Deliverable 4: Proportional Controller

For the proportional controller, we defined error as the difference between the desired temperature and the current temperature. 
Since 'setpower' in MATLAB is the percentage of the total power, we converted the power to percent. 

Gain=0.05 Experimental(left) and Simulation (right)

Gain=0.2 Experimental (left) and Simulation (right)

Gain=0.5 Experimental (left) and Simulation (right)


Q1:
When the gain is too small (0.05), the experimental results to not show significant changes in temperature.

Q2:
When the gain is too high, the system behaves more like a bang-bang controller (like the one from deliverable 3) because it is essentially set at full power for most of the time. The graph proves this because the temperature increases almost linearly until it levels out.

Q3:
Gain=0.2 is the optimal gain setting because the graphs show that the rate of temperature increase (dT/dt=slope of the graph) is the greatest at lower temperatures and gradually decreases as temperature gets higher. This is what we would expect to happen in a proportional controller.

Link to Proportional Controller .m file:

Link to Proportional Control Simulation .m file:


Deliverable 5:


PI Experimental Script
 

PI Experimental

PI Simulation (Temperature graph in red, power graph in blue)

 Link to PI Control Experimental .m file:
https://drive.google.com/file/d/0Bymp1CBCUUYRMk0ySG95UGtteE0/edit?usp=sharing


Link to PI Control Simulation .m file:
https://drive.google.com/file/d/0Bymp1CBCUUYRWmlhMm1jbDFmUWc/edit?usp=sharing


Friday, April 4, 2014

MATLAB Thermal Systems Part 1

Answer to Question 1:


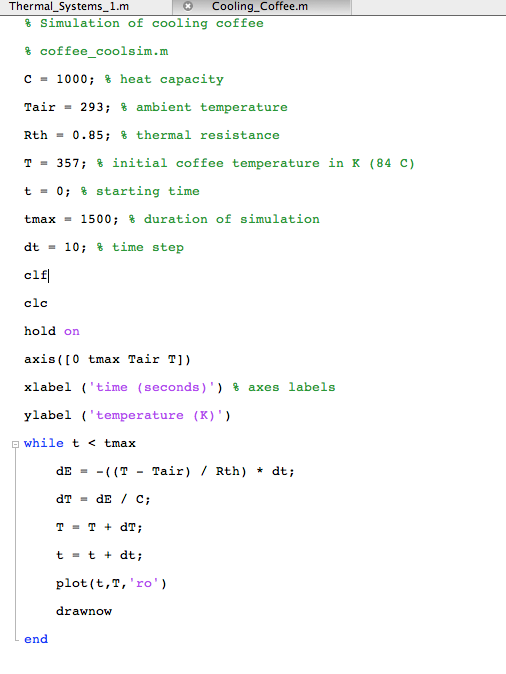
Using the above equation, we predicted that increasing the Rth will make dT less negative and make cooling slower. 

Increasing C will also make dT less negative and make cooling slower.

Initially, we had Rth=0.85 and C=1000


 In order to check if our predictions were correct, we increased Rth to  2:

As seen in the graph, the slope is less negative and the temperature decreases at a slower rate. At 1,500 seconds, the initial graph shows a temperature decrease of ~50K and the second graph shows a temperature decrease of ~35K.

Similarly, we increased C to 2000:
 which also shows a decrease in cooling rate.


Decreasing Rth and C would have the inverse effect, and lead to faster cooling.


To make the comparison easier, I plotted multiple graphs representing different C values.


Changing C


Starting from the topmost graph, C= 2500, 2000, 1500, 1000 and 500.
For a given time interval, there is less decrease in temperature for a higher C value.


Similarly, we can also plot a graph for different Rth values:


Changing Rth

Starting from the topmost graph, Rth = 4.25, 3.4, 2.55, 1.7, and 0.85.
As we predicted, there is less temperature decrease at a given time interval for a higher Rth value.

Link to Changing C .m file
https://drive.google.com/file/d/0Bymp1CBCUUYRVmptQmFlZ2xkeVE/edit?usp=sharing

Link to Changing Rth .m file
https://drive.google.com/file/d/0Bymp1CBCUUYRNWFacFY1YUZWd0E/edit?usp=sharing

Answer to Question 2:

To figure out the good P value, we need to utilize the information about dT at 84 degrees.

Since we want to maintain the temperature of our coffee at 84 degrees Celsius (357K), we want dT=0 after dt=2000 seconds. We also know Tair=293K and Rth=0.85.

Plugging this information into the given equation and solving for P:     
A good P value is 75.3.


Working Backwards

The graph on page 7 of the assignment sheet shows that it reaches a final temperature of 356 K. Using this information, we can solve for Rth:
To solve for C we make estimations for the slope at time t=0. Looking at the graph, we made an estimation that dT/dt at t=0 is approximately 0.07.
Using this information to solve for C:


 Feedback and Control

1) Heating Coffee Using Bang-Bang Control:

For bang-bang control, we kept all of the initial conditions, but added a if-else statement inside the while loop and set the power to 90 when the temperature is less than the desired temperature (357K) and 0 when the temperature is greater than the desired temperature.


Bang-bang control graph
Link to Bang-Bang Control .m file:
https://drive.google.com/file/d/0Bymp1CBCUUYRRklmcXAxd3pPNHM/edit?usp=sharing


Q: Why is bang-bang control appropriate for many thermal systems? When might it be insufficient?

Bang-bang control is appropriate for thermal systems because it is simple. It just requires a heater that can be turned on or off and a thermometer. It doesn't require subtle controls of the heater power. 

Bang-bang control might be insufficient if there is a fast change in temperature of the system. For example, if the the temperature of the system fluctuates at a fast rate, turning the heater on and off might not occur fast enough to maintain a stable temperature. 


2) Heating Coffee Using Proportional Control:

For proportional control, we set power equal to the error multiplied by gain, where error is the difference between the measured temperature and the desired final temperature.


Proportional Control Graph
 
We noticed that the temperature levels off at different points when gain is varied. This is because there is a point where dE_in and dE_out is equal to each other as error and power gets smaller. Therefore, the graph would level out at the temperature that makes dE_in and dE_out equal. 

We could try to achieve the desired results if we set the final temperature at a higher value than our actual desired temperature.


Q: How does this approach compare to the bang-bang control?

Compared to bang-bang control, the proportional control maintains a constant temperature more smoothly, without any fluctuations.  

Link to Proportional Control .m file:
https://drive.google.com/file/d/0Bymp1CBCUUYRUnBOX0tHMHdQbVk/edit?usp=sharing


3) Bang-Bang Control  with Delay:


Bang-bang Delay


For the bang-bang control with a delay, we start out with a for-loop that goes through until t=tmax. Since t changes in intervals of dt, the maximum index of the for-loop is (tmax/dt). 

With a delay, the sensor would not read anything until the time passes the delay time. During this time, the power would be zero. After the delay time, we can start heating the system. This is modeled by the first if-else statement. 

The power can be set according to the temperature displayed on the sensor, which is T(i-delay). Since this is bang-bang control, we set the power to 90 only when the temperature read by the sensor is less than the final desired temperature. Else, the power is zero. This is modeled in the second if-else statement nested under the first 'if'.    
Q: What is the impact of this "sensor delay"?

The graph shows the initial delay and the fluctuations in temperature caused by overshooting and undershooting. The overshooting and undershooting is caused by the discrepancies between the actual temperature and the temperature read by the sensor.  Even when the actual temperature reaches the desired temperature, the sensor reads a different value and supplies the power accordingly, causing the temperature to over/undershoot.

Link to Bang-Bang Delay .m file:
https://drive.google.com/file/d/0Bymp1CBCUUYRT3NpZ2NBZ25IUkU/edit?usp=sharing 


4) Proportional Control with Delay


 All we changed for the proportional control is to set the power equal to gain x error, where error is Tf-T(i-delay). As in the previous script, P=0 when the time has not passed the delay time. 

Proportional Control Delay

Q: What is the impact of this "sensor delay"?

There is an initial overshoot caused by the delay followed by an undershoot in temperature, but as the error gets smaller, the overshoot and the undershoot also gets smaller and eventually the temperature levels out. 

For a system with a delay in the sensor, proportional control seems like a better way to maintain a constant temperature.


Link to Proportional Control Delay .m file:
https://drive.google.com/file/d/0Bymp1CBCUUYRcTFMejJpYlZIdVk/edit?usp=sharing 


Q: What other delays might you expect in your thermodynamic system, apart from sensor delays?

Apart from sensor delays, there could also be delays caused by the heater. There could be a discrepancy between the time when the power changes and the time it actually affects the temperature of the coffee. 
Also, depending on where and how the heater is positioned, it might take some time for ALL of the coffee to reach the same temperature. In other words, the coffee that is closer to the heat source can heat up faster than the coffee furthest away from the heater.